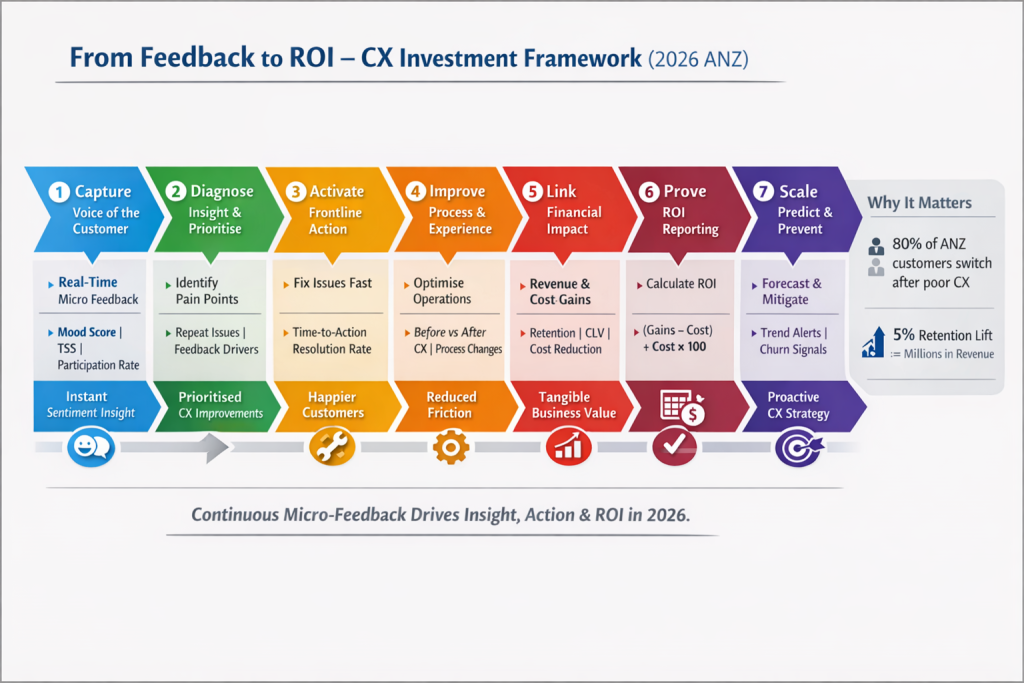
A Practical Measurement Model for 2026
This model shows how real-time customer feedback becomes financial return, even in a constrained economic environment.
1️⃣ Capture: Feedback at the Moment That Matters
Goal: Collect high-volume, low-friction insight at critical touchpoints.
What to Measure
Customer Mood Score
Touchpoint Satisfaction Score
Negative Feedback Rate
Participation Rate
Why This Matters in 2026
Consumers are time-poor and cost-sensitive
Long surveys = low response + delayed insight
Real-time feedback captures emotion, not memory
📌 Output: Live sentiment data by location, channel, time
2️⃣ Diagnose: Turn Signals Into Insight
Goal: Identify patterns, not just scores.
What to Analyse
Top drivers of negative sentiment
Repeat issues by location or shift
Correlation between feedback and operational metrics
Example Diagnostic Views
“Top 3 friction points per site”
“Sentiment by wait time”
“Negative spikes vs staffing levels”
📌 Output: Prioritised CX issues with operational context
3️⃣ Activate: Frontline Action & Ownership
Goal: Fix issues where they happen.
What to Measure
Time-to-Action (TTA)
Issue Resolution Rate
Frontline Engagement Rate
Why This Matters
Fast action prevents escalation and churn
Empowers frontline teams during labour shortages
Reduces cost-to-serve
📌 Output: Logged actions tied to specific feedback themes
4️⃣ Improve: Operational & Experience Change
Goal: Make permanent improvements, not temporary fixes.
What to Measure
Repeat Issue Frequency
Process Improvement Count
CX Before vs After Scores
Examples
Queue redesign → reduced wait dissatisfaction
Staff training update → improved service sentiment
Digital change → fewer complaints
📌 Output: Evidence of sustained CX improvement
5️⃣ Link: CX to Financial Outcomes
Goal: Translate CX improvements into dollars.
Revenue Impact Metrics
Increased visit frequency from satisfied customers
Higher conversion or basket size
Retained customers previously at risk
Cost Impact Metrics
Reduction in complaints and escalations
Lower rework and service recovery costs
Fewer refunds or credits
📌 Output: Quantified revenue protected or generated
6️⃣ Prove: ROI Calculation
Goal: Demonstrate commercial value clearly.
Example ROI Formula
ROI (%) =
(Financial Gains – Cost of CX Program) ÷ Cost of CX Program × 100
Example
Revenue retained from churn reduction: $450,000
Cost savings from fewer complaints: $120,000
Total CX program cost: $150,000
ROI =
(($570,000 – $150,000) ÷ $150,000) × 100 = 280% ROI
7️⃣ Scale: Predict & Prevent
Goal: Move from reactive to predictive CX.
Advanced Metrics
Sentiment Trend Velocity
Early Churn Risk Signals
Location Risk Heatmaps
Why This Matters in 2026
Economic volatility requires early warning systems
CX becomes a risk management function, not just marketing
📌 Output: Predictive CX insights guiding investment decisions
The Full Model at a Glance
| Stage | Focus | Key Metrics | Outcome |
| Capture | Real-time feedback | Mood, TSS | Truth |
| Diagnose | Pattern detection | Drivers, trends | Insight |
| Activate | Frontline response | TTA, resolution | Action |
| Improve | Process change | Repeat issues | Improvement |
| Link | Financial impact | Revenue & cost | Value |
| Prove | ROI | ROI % | Credibility |
| Scale | Prediction | Risk signals | Resilience |
Executive Takeaway
In 2026, feedback is no longer a CX metric — it’s a financial input.
Organisations that:
– Capture feedback continuously
– Act on it quickly
– Measure outcomes commercially
will outperform those still relying on quarterly surveys and lagging indicators.